Student Achievement Goals & Outcomes
Student learning and student success are at the core of Gulf Coast State College’s (GCSC) mission.
Mission:
Gulf Coast State College holds students and community of central importance. The College provides many opportunities for learning and offers a range of programs and services to help students become well-educated, productive citizens. The College is equally dedicated to collaborating with the community to help create or improve economic well-being and to offer the space of the College for social dialog, events of art and culture and other moments that enhance our quality of life.
Criteria:
GCSC sets student achievement goals and evaluates the success of achieving those benchmarks in the following areas:
- Retention rates
- Graduation rates*
- Passing rates by instructional method
- Median wage of graduates who are employed full time
- Continuing education or employment
- Transfer-out graduates’ performance in the State University System (SUS)
Note. GCSC uses IPEDS' Graduation Rate (150% of standard time) definition and metric to evaluate the student completion indicator. This metric was selected as an effort to track, evaluate, and improve student success.
Metrics in Relation to GCSC's Mission
| Direction | Goal | Metric |
|---|---|---|
LEARNING FIRSTCreate a culture that focuses on student success by promoting academic excellence and continued improvement in the teaching and learning process. |
|
|
STUDENT SUCCESSContinuously develop new and innovative approaches to recruit, retain, and graduate students. |
|
|
ACCESSIBILITY & STUDENT ENGAGEMENTPromote a culture of civility to include openness, trust, collaboration and mutual respect that is built upon a range of diverse backgrounds, ideas, and perspectives that enhance student learning and institutional improvement. |
|
|
Note. Directions and Goals are listed in the 2022-2027 Strategic Plan.
The following thresholds are the minimum expectations GCSC uses to define its acceptable level of achievement:
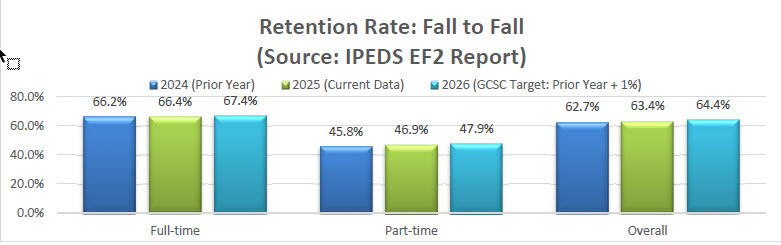
- For retention rate, the threshold is calculated by using the prior year rate and adding a percentage improvement point.
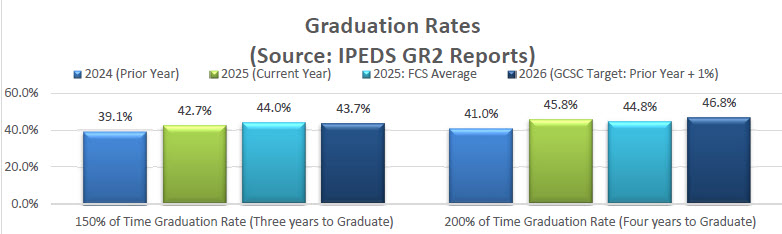
- The graduation rate thresholds are either improving the prior year rate by one percent or surpassing the Florida College System (FCS) Average.
- For Wages and Continuing Education or Employment, the target is met if it matches or surpasses the prior year metric and or the FCS.
- For Transfer-out graduates’ performance at SUS, students’ performance is compared against the FCS AA graduates or Native SUS students. The target is met if the student achievement matches or surpasses the comparison groups.
GOAL Outcomes:
Retention Rates were calculated using a cohort of fall beginning-of-term first-time in college (FTIC) degree/certificate seeking students. Retained students were enrolled at the same institution the following fall.
Graduation rates were calculated using a cohort of fall beginning of term first-time in college (FTIC) degree seeking/certificate seeking students. Students graduated within 150% or 200% of their expected time to graduation. The timeline below corresponds to an Associate of Arts (AA) degree. Other programs may have different 150% and 200% end dates.
IPEDS 150% Graduation rates are also disaggregated by gender and financial aid.
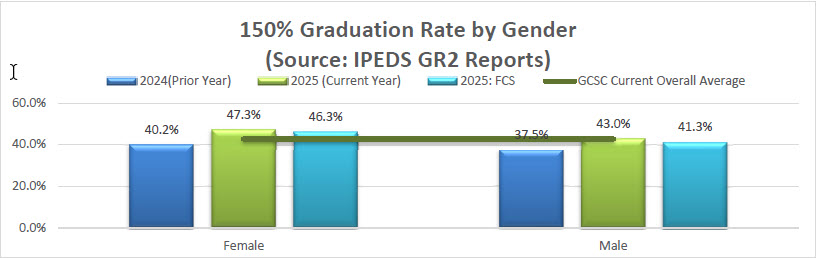
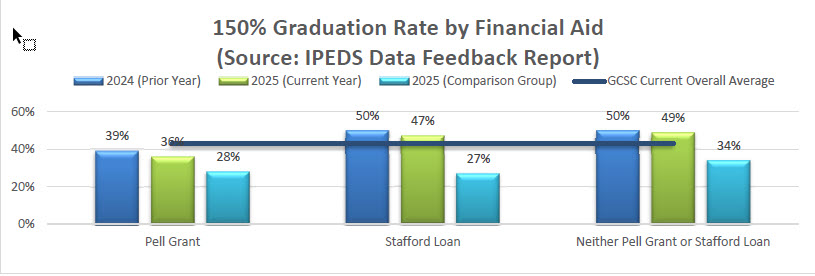
Note. IPEDS Data Feedback Report 2025 (January 2026). Source: U.S. Department of Education, National Center of Statistics, Integrated Postsecondary Education Data System (IPEDS); Winter 2024-25, Graduation Rates survey components. Current year: Fall 2021-22 through Summer 2024-25. The comparison group is determined by IPEDS based on GCSC institution’s characteristics. The characteristics include degree-granting four-year, primary associate’s, Carnegie classification of Associate’s Dominant, public and enrollment of a similar size. The comparison group is comprised of 31 institutions.
Success Rates were calculated as the percentage of A, B, C or P grades.
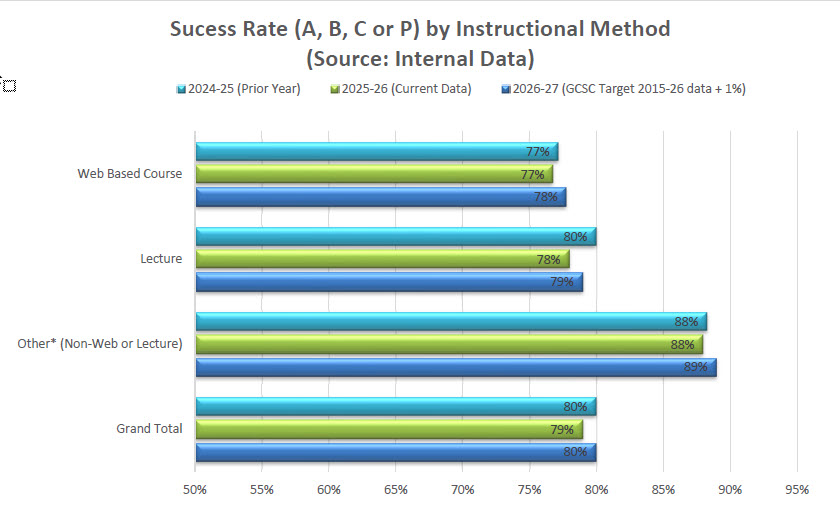 Note. "Other" is defined as courses that use an instructional method different from web-based
or hybrid (e.g., Lecture, Labs, etc.). Incomplete and audit grades were removed.
Note. "Other" is defined as courses that use an instructional method different from web-based
or hybrid (e.g., Lecture, Labs, etc.). Incomplete and audit grades were removed.
Graduate wages were collected from the Florida Department of Education's (FLDOE) Florida Education and Training Placement Information Program (FETPIP).
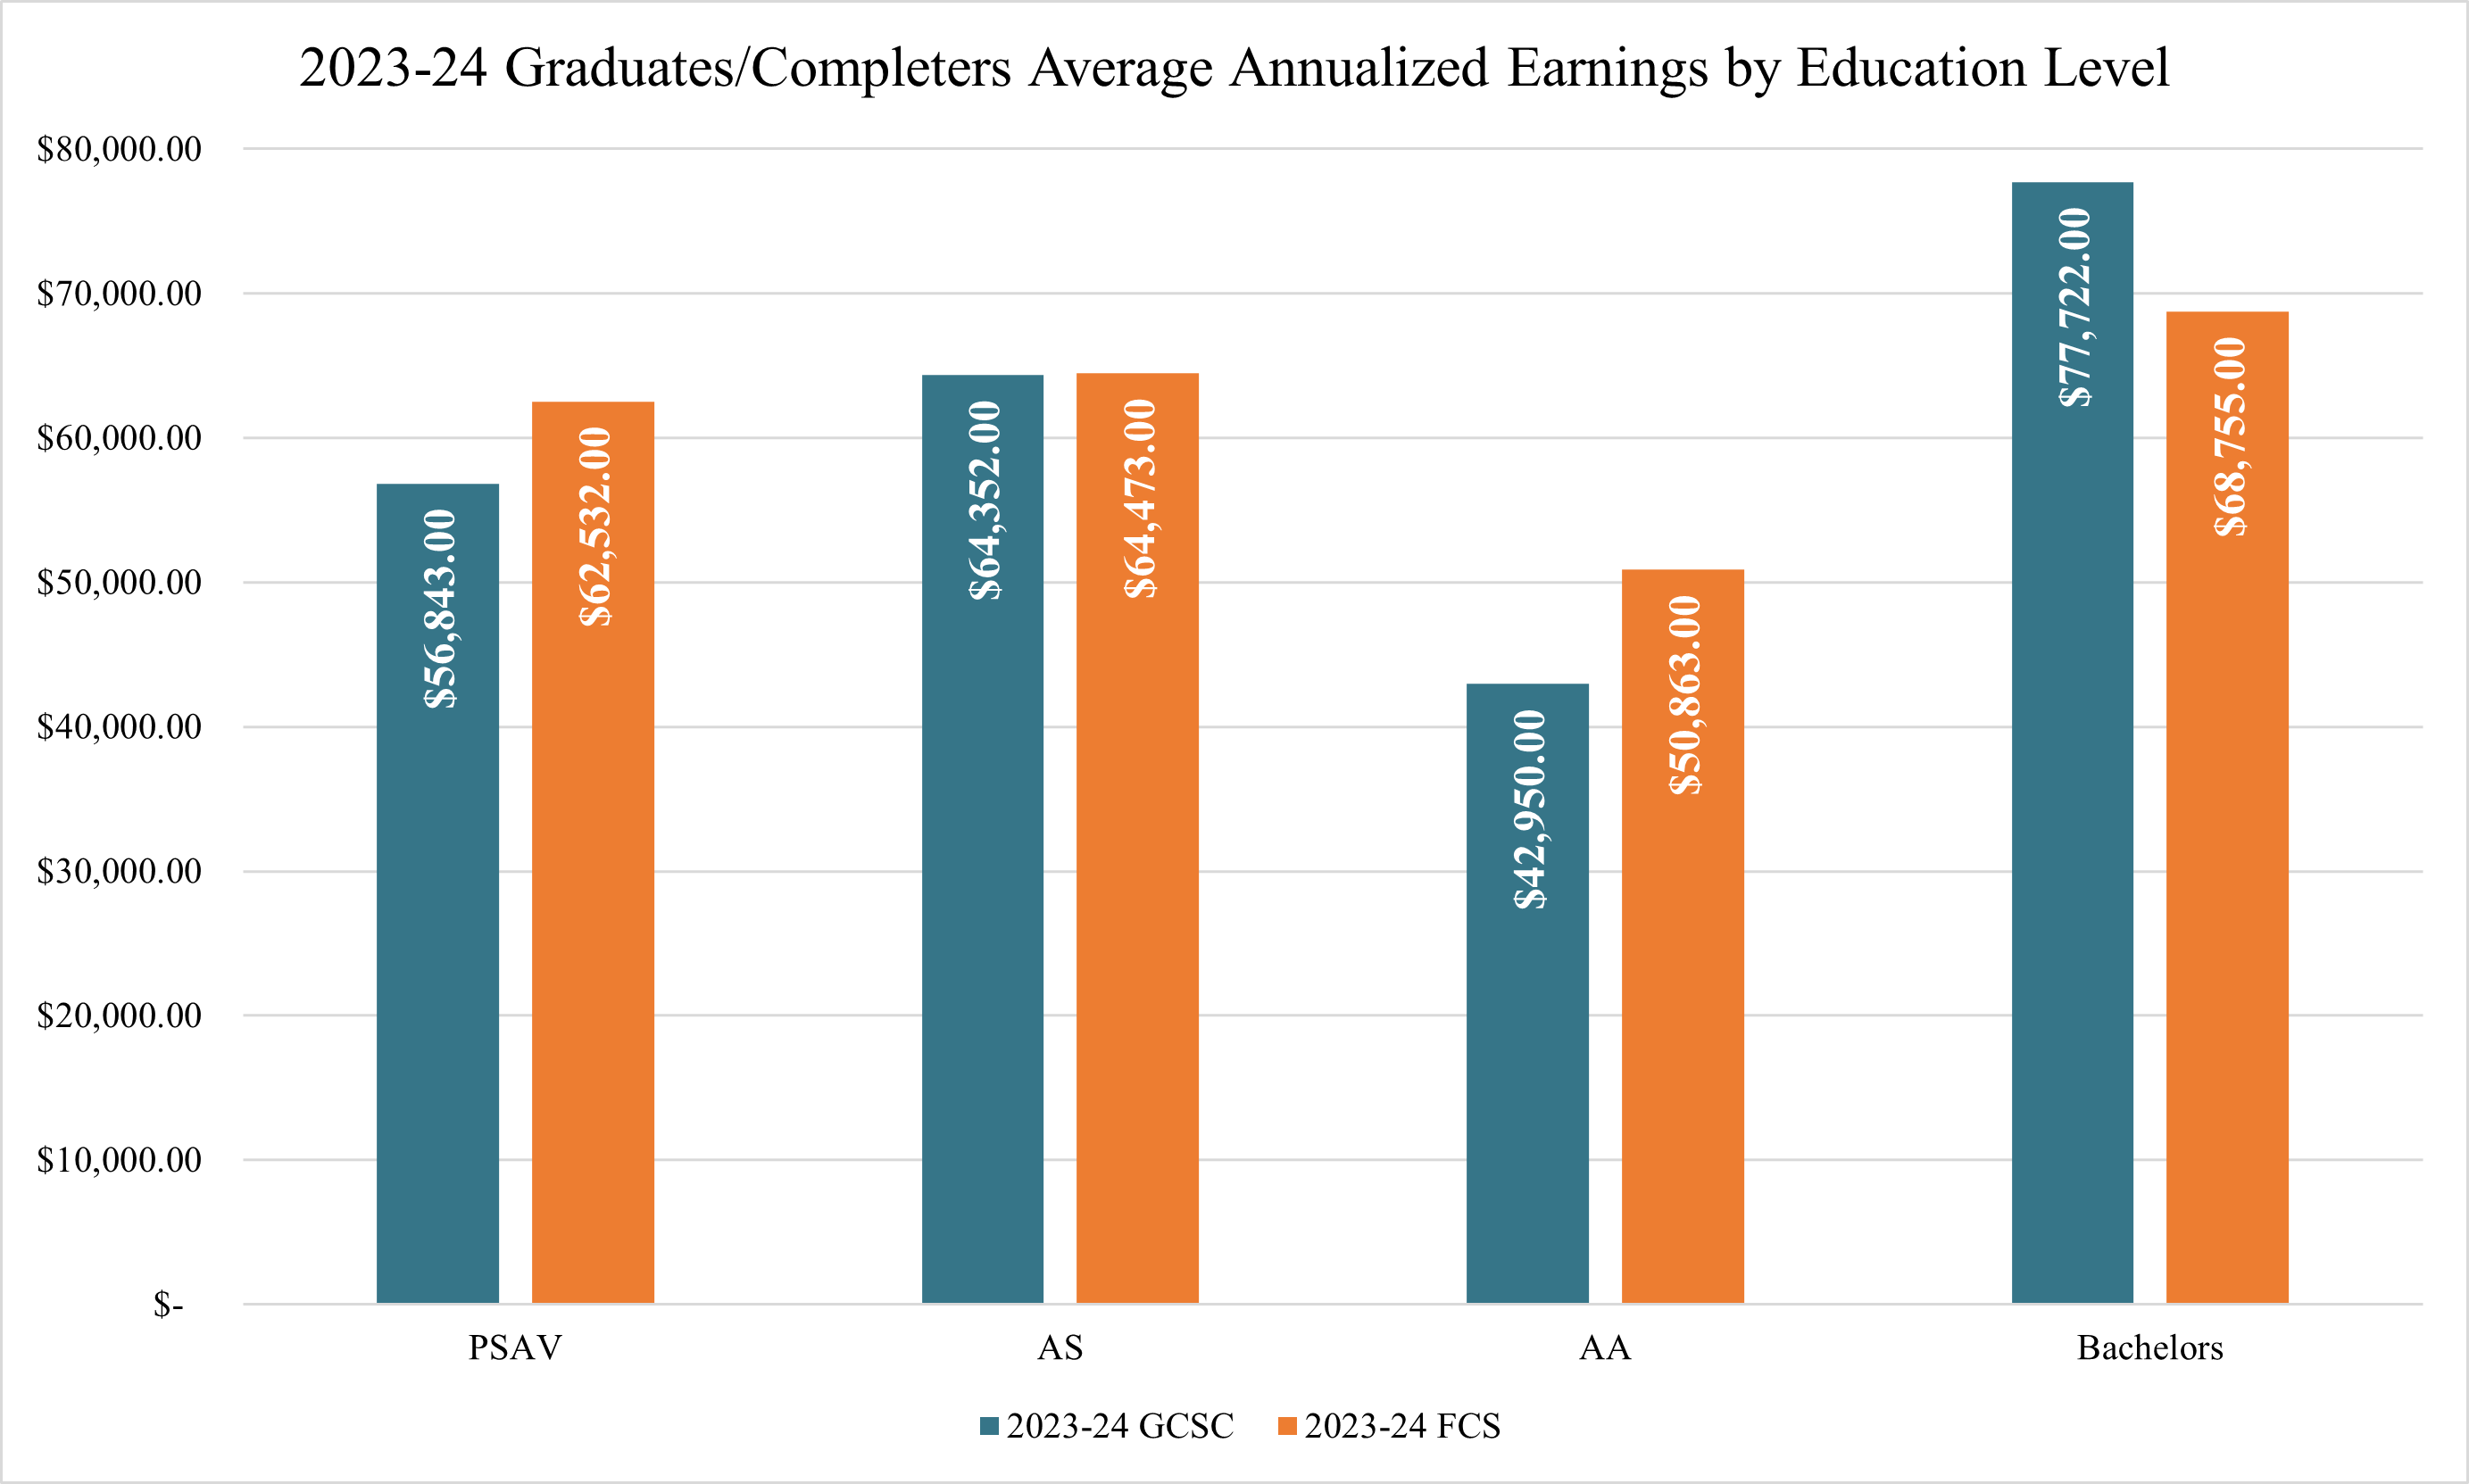 Note. Data includes students not continuing education with full-time employment in Florida
(Fall 2024).
Note. Data includes students not continuing education with full-time employment in Florida
(Fall 2024).
The following Continuing education or Employment rates were obtained from 2023-24 Florida College System Reports published by FLDOE.
|
Credential Type |
Comparison Group |
Graduates Who Continued Education (%) |
Graduates Found to be Employed (%) |
Graduates Who Continued Education or Found to be Employed (%) |
|
Associate in Arts Degree Completers |
GCSC |
67% |
62% |
87% |
|
FCS |
71% |
62% |
89% |
|
|
Associate in Science Degree Completers |
GCSC |
26% |
77% |
83% |
|
FCS |
36% |
80% |
87% |
|
|
Bachelor Degree Completers |
GCSC |
14% |
77% |
79% |
|
FCS |
8% |
77% |
79% |
Source: FLDOE’s FETPIP.
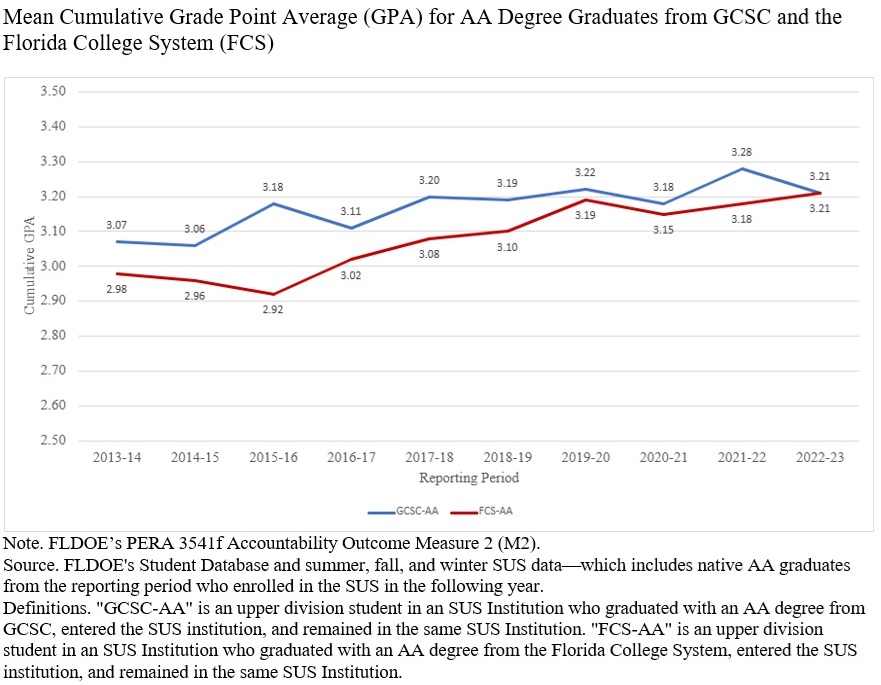
AA Graduates' Performance at the SUS System, is calculated as mean cumulative Grade Point Average (GPA) using the following definitions:
- GCSC-AA is an upper division student in an SUS Institution who graduated with an Associate in Arts degree from Gulf Coast State College, entered the SUS institution and remained in the same SUS Institution.
- FCS-AA is an upper division student in an SUS Institution who graduated with an Associate in Arts degree from the Florida College System, entered the SUS institution and remained in the same SUS Institution.
This webpage was most recently updated by GCSC's Office of Institutional Research on 08/05/2026.